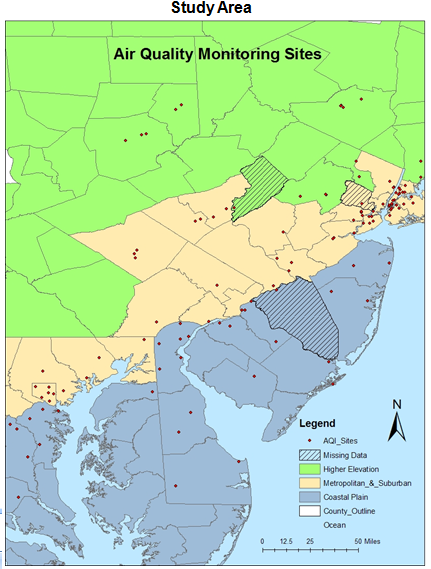
*The following is based on the daily AQI values reported by the United States Environmental Protection
Agency for April to July of 2004. There were 45 different counties in DE, MD, NJ, NY, and PA examined and
some intriguing relationships were found. Such as to physical features, specific weather patterns, sources
regions, and sinks. The basic weather regimes included 500hPa features (trough, zonal, ridge), flow
directions (north, northwest, etc), surface features (high and low pressure, warm and cold front).
All the variations suggest a need to improve the operational prediction and assessment of AQI patterns
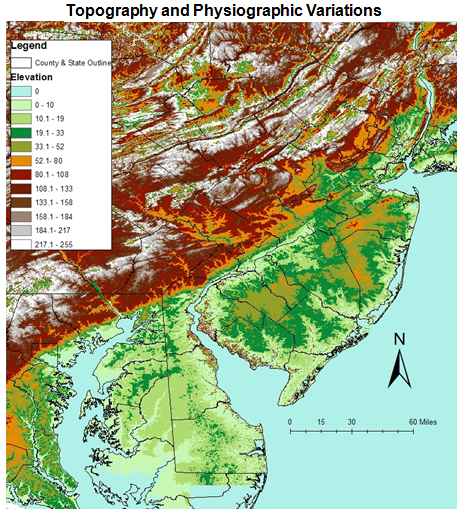
according to specific weather regimes. In some situations the patterns reflected topographic variations, urban
or industrial centers or pollution sources, and the possibility of observational network bias, or the role
of mesoscale phenomena. For more information
Click Here (PDF File).